An analytics minute
Titanic. Family ties.
Barev!
We continue figuring out the Titanic survival dataset with the help of SQL.
This time we'll look at the mysterious features sibsp and parch.
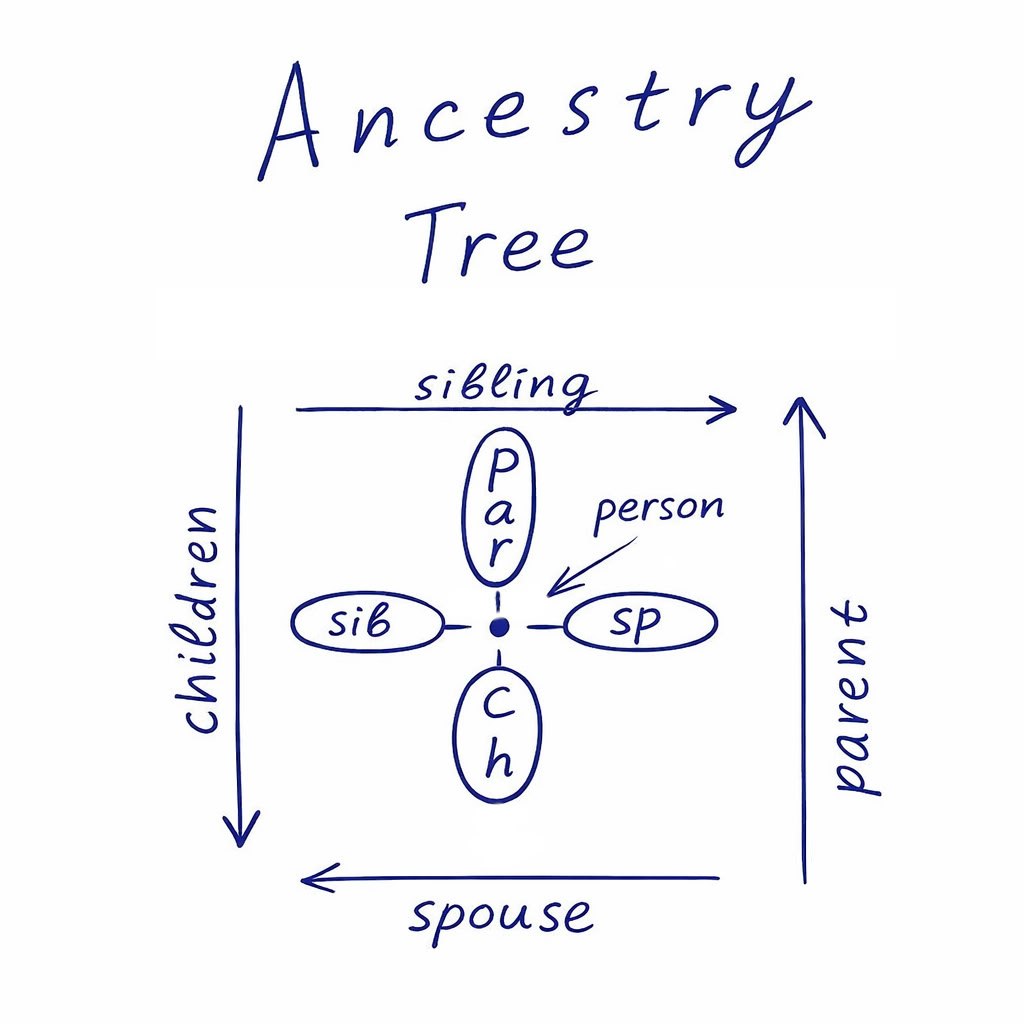
It took a moment, but we realized that one is about the horizontal direction in a family tree, the other about the vertical.
Vertically go parents and children. Horizontally - siblings (brothers and sisters) and spouses (husbands/wives).
So how do we write a query that gives us enough information about the new features?
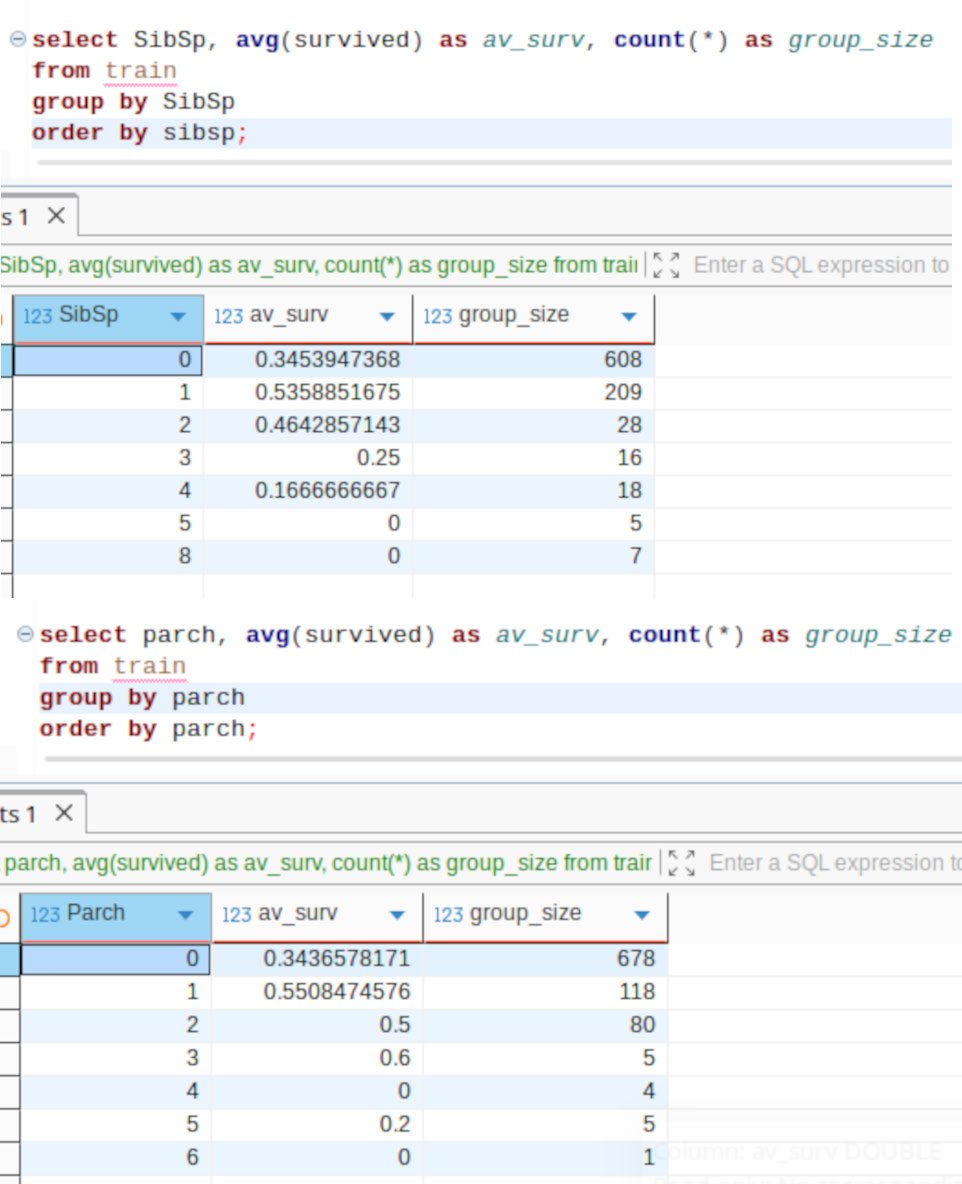
The first big block - SELECT. In it we say we're interested in the value of the sibsp feature, then, after a comma, the average survival rate for that value of the feature. Then, after another comma, the size of the group (the number of passengers with exactly that many siblings on the trip).
Next, we mustn't forget to say where we take the data from. From the train table. So: FROM train
A very important thing: we gather passengers into little piles, so that all passengers in a pile have the same number of siblings + spouses. GROUP BY sibsp
The last block - for convenience. Let sibsp grow from top to bottom. ORDER BY sibsp
We do the same for parents and children.
What can we notice looking at the resulting little tables?
The features look good. In the highlighted groups the survival rate comes out different.
One question remains. And what about the whole "flower" all together? What happens if we count the size of a passenger's entire family on the ill-fated ship? About that - in the next episodes of our series.
#education #junior #analytics