Getting into analytics
Barev, everyone!
An evening minute of programming.
Prompt engineering is great. But at some point we sat down, ran the numbers, and decided that if you back it up with analytics skills, it gets even better. But here's the question - when people ask you to say "something in that analytics language of yours," what do they mean first and foremost? Python and SQL, it seems. So that's where we started. Python and SQL.
We've already written about Python, I think. That's the one with the drone flying around, landing and re-landing all over the place. But SQL - not yet. Did you know it's not "es-cue-el" but "sequel"? Professional deformation and jargon. Like sailors putting the stress on the wrong syllable of "compass." Structured Query Language. For pulling meaning out of data.
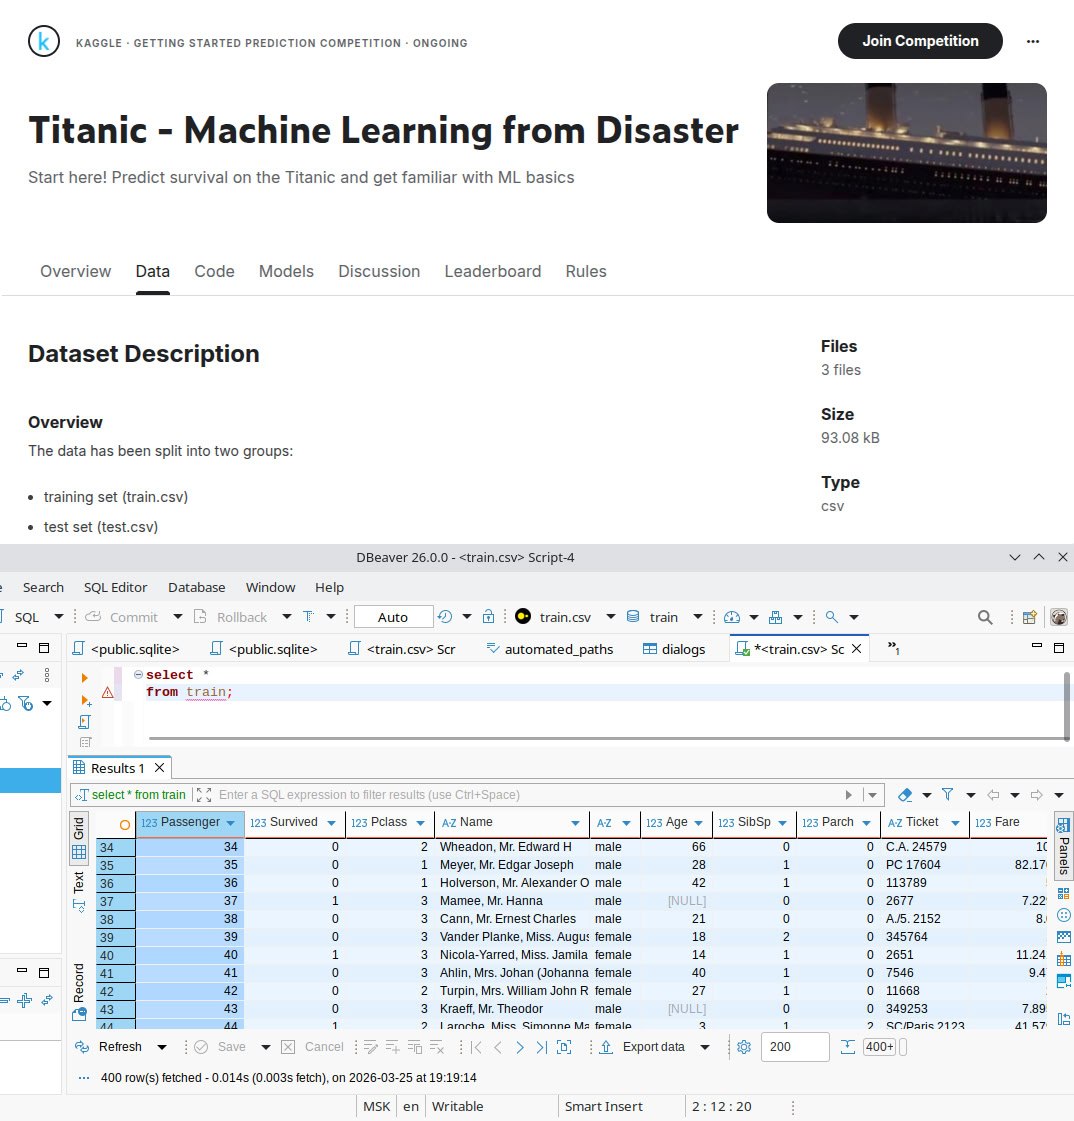
But to pull meaning out, you need some data. We thought and thought and came up with the idea of taking the Titanic dataset. By today's standards of internet petabytes and Large Language Models, this dataset is a crumb - 891 records to train on and about 400 more to test on. Only Fisher's irises are smaller, perhaps.
We started poking around and found a fun trick. A CSV file (text with commas between the elements) can be fed not only into Python but also into the DuckDB plugin of DBeaver. Now the fun really begins. You can write a program in Python, or you can write queries in SQL.
So, for example, let's look at the average survival rate across the whole dataset
source = open("titanic.csv")
n_pass = 0
n_surv = 0
header = next(source)
for line in source:
  survived = int(line.split(",")[1])
  n_pass += 1
  s_surv += survived
print("n_pass =", n_pass, "n_surv =", n_surv, "surv rate =", n_surv/n_pass)
source.close()
We opened the file and set up two variables - one for the number of passengers, one for the number of survivors. We ran through the file in iterator mode (take a file as a container in a loop and the lines spill out of it one by one). Oh, right - we didn't forget to pull the first line out separately with next(). Because that's the header, and the data comes afterward. We split the line into parts by commas, took the second one (we already know by heart which field holds the survivors), and converted it to an integer. For passengers we add 1 on every turn of the loop no matter what; for survivors, the flag from the dataset. And that's it. We print the total number of passengers, how many survived, and the survival rate - 38% (we already remember that one by heart).
And now, how the same thing looks in SQL
select avg(survived) as avg_surv
from titanic
Two big building blocks: select + from. And in almost plain English we write that we want to see the average over the survivors. Somehow it comes out shorter in SQL. Now why would that be...
#education #junior #analytics